2025-26 Season In-Game Bouncebackability:
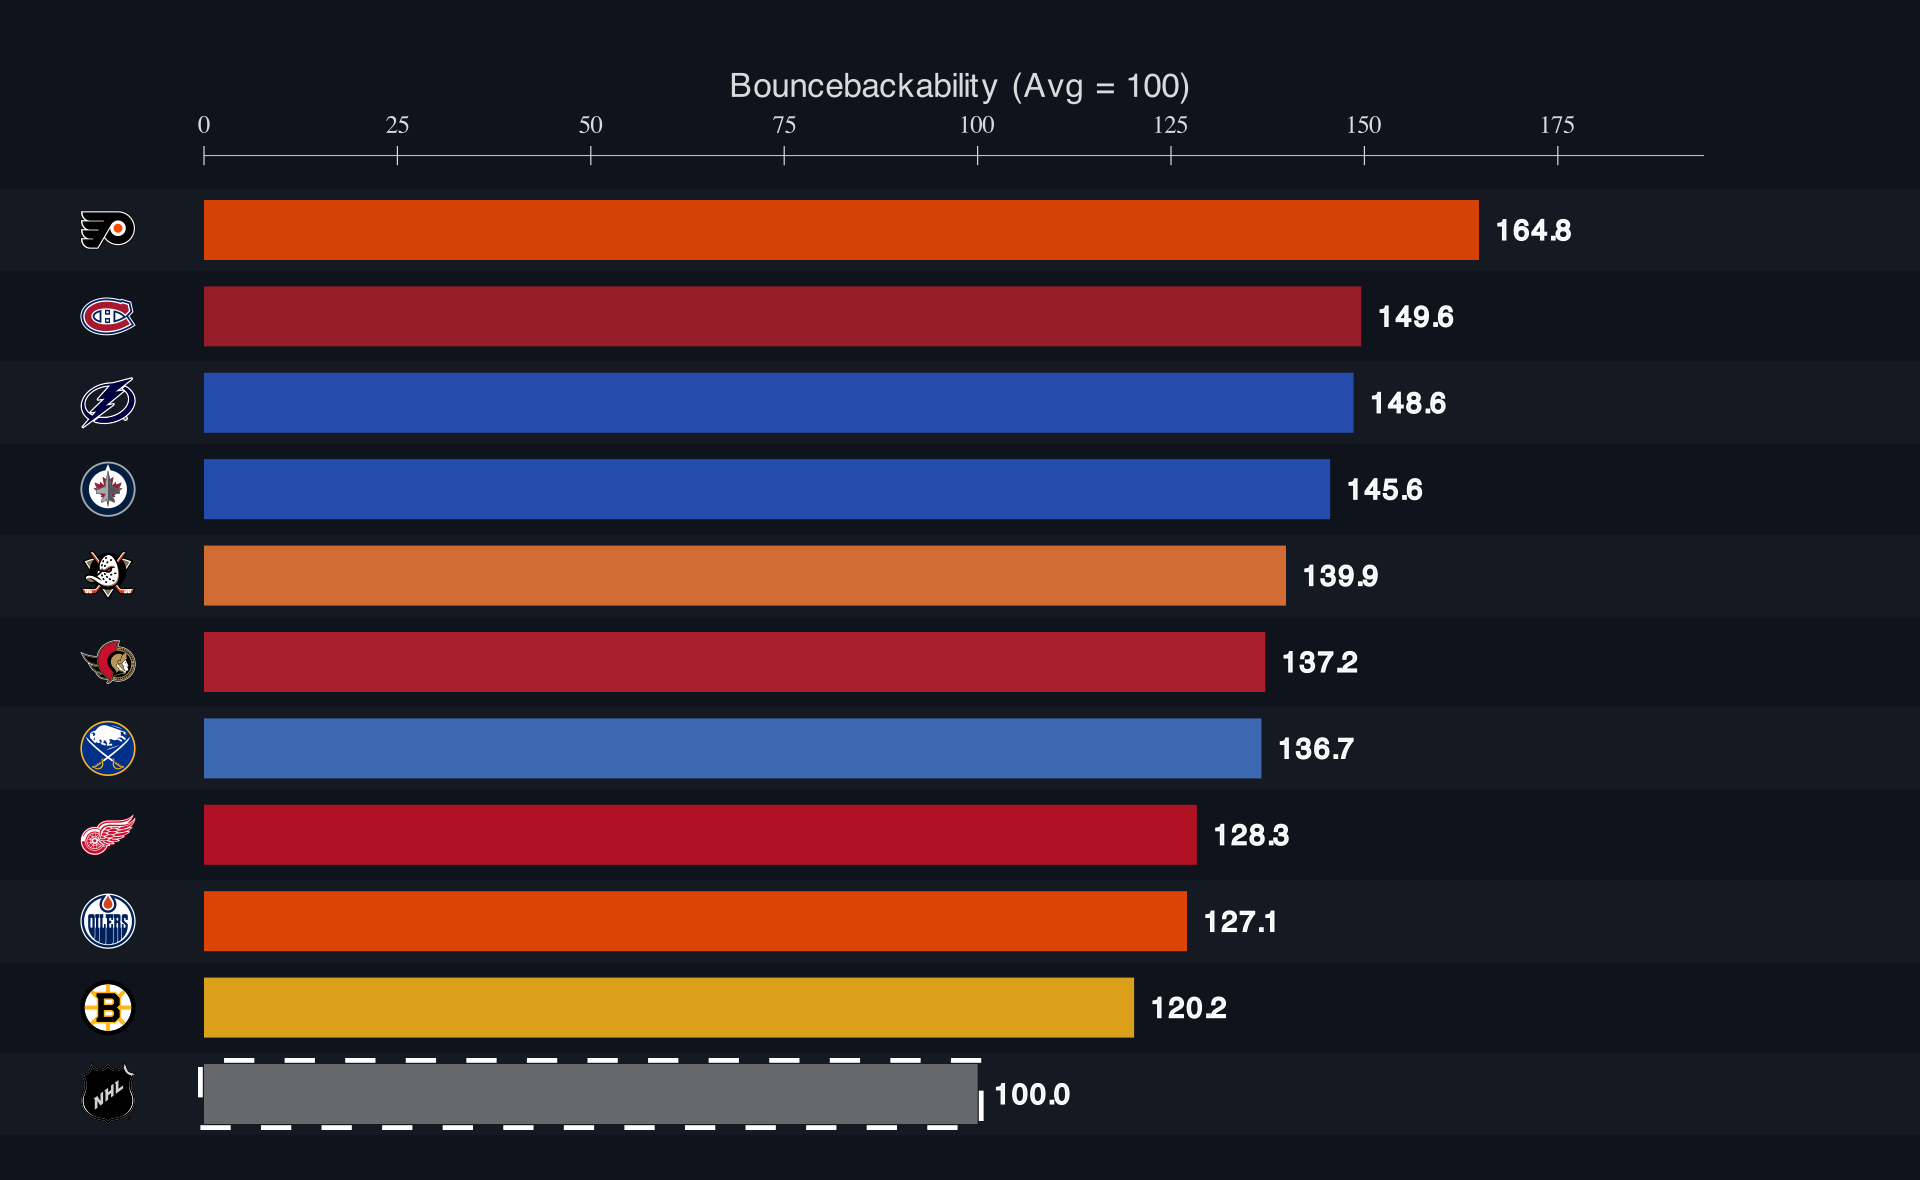
Good Bouncebackability
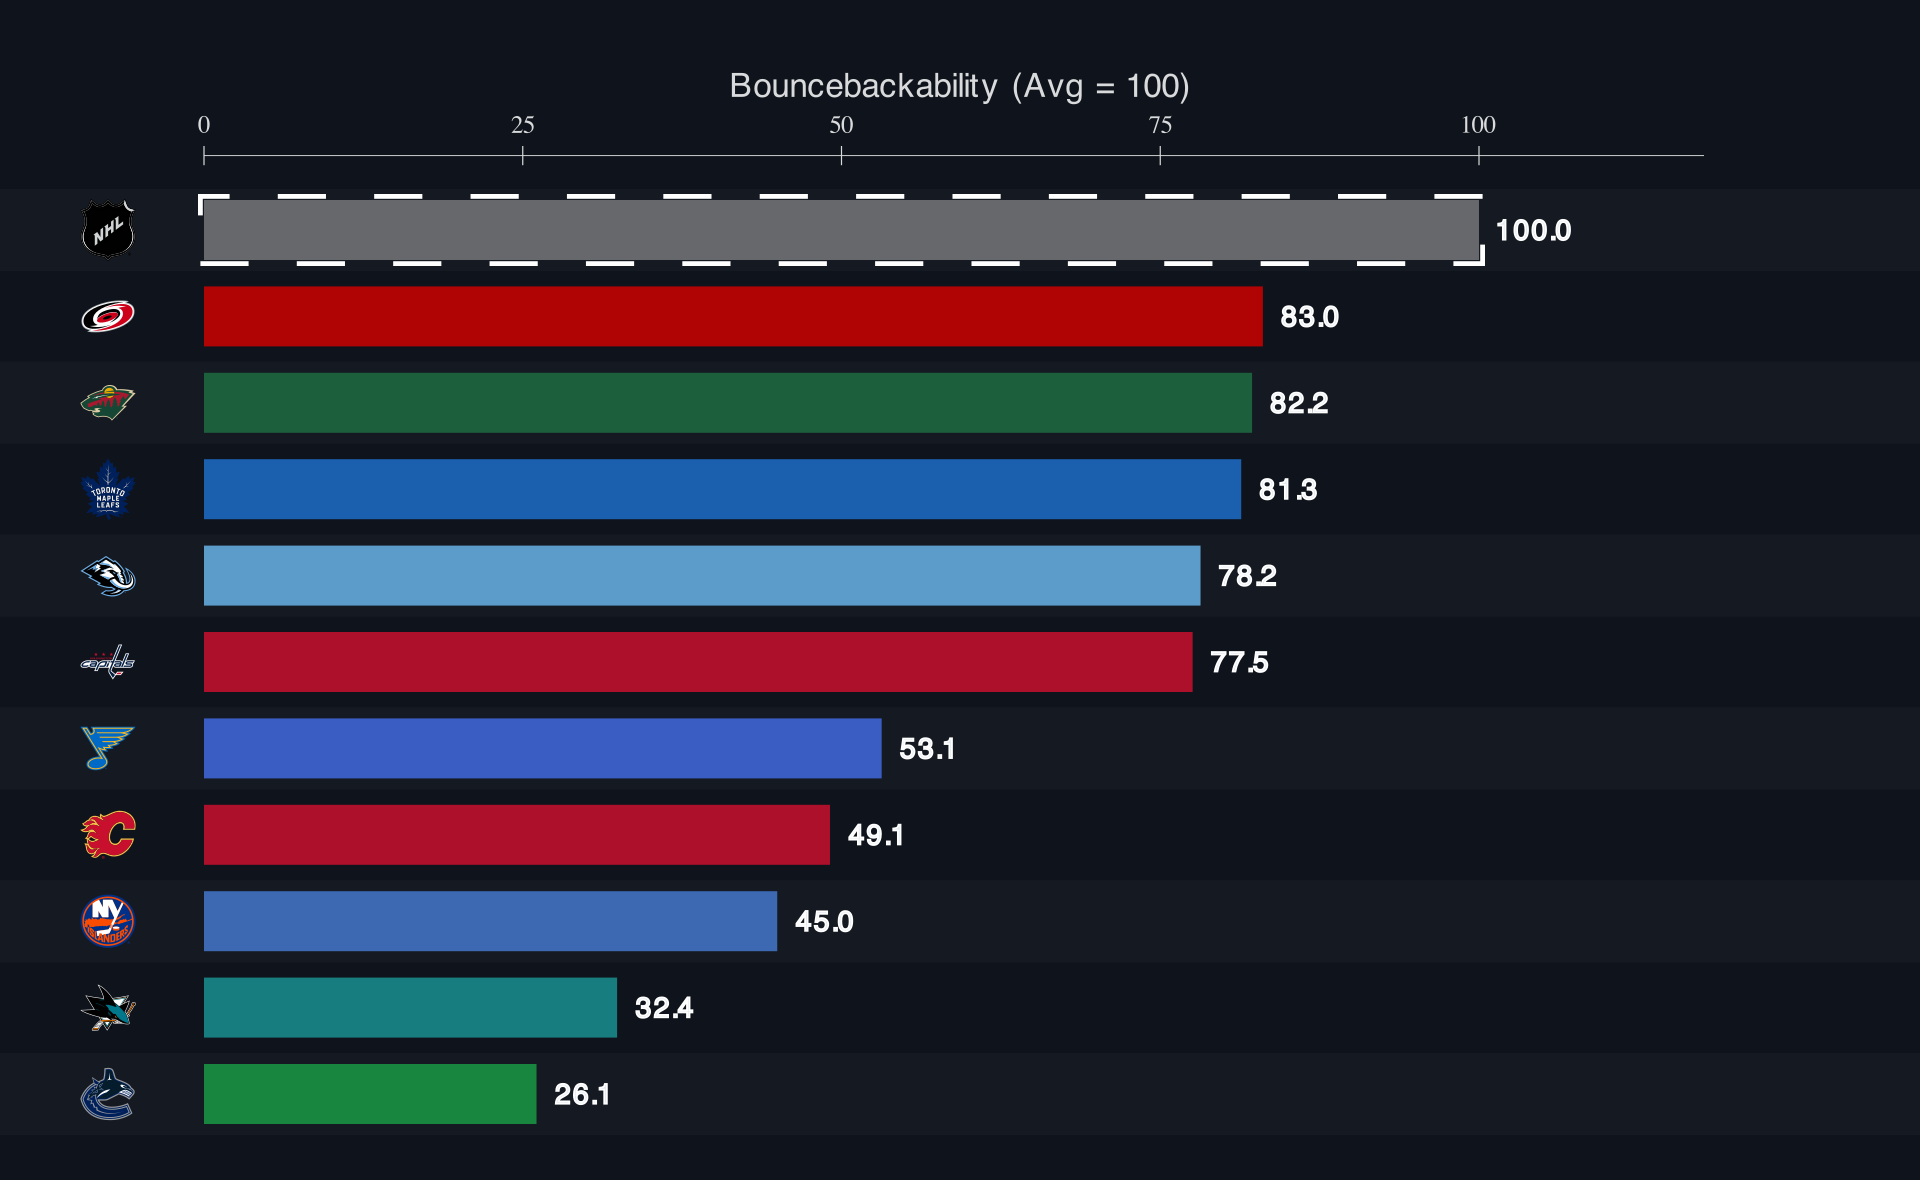
Poor Bouncebackability
Commentary:
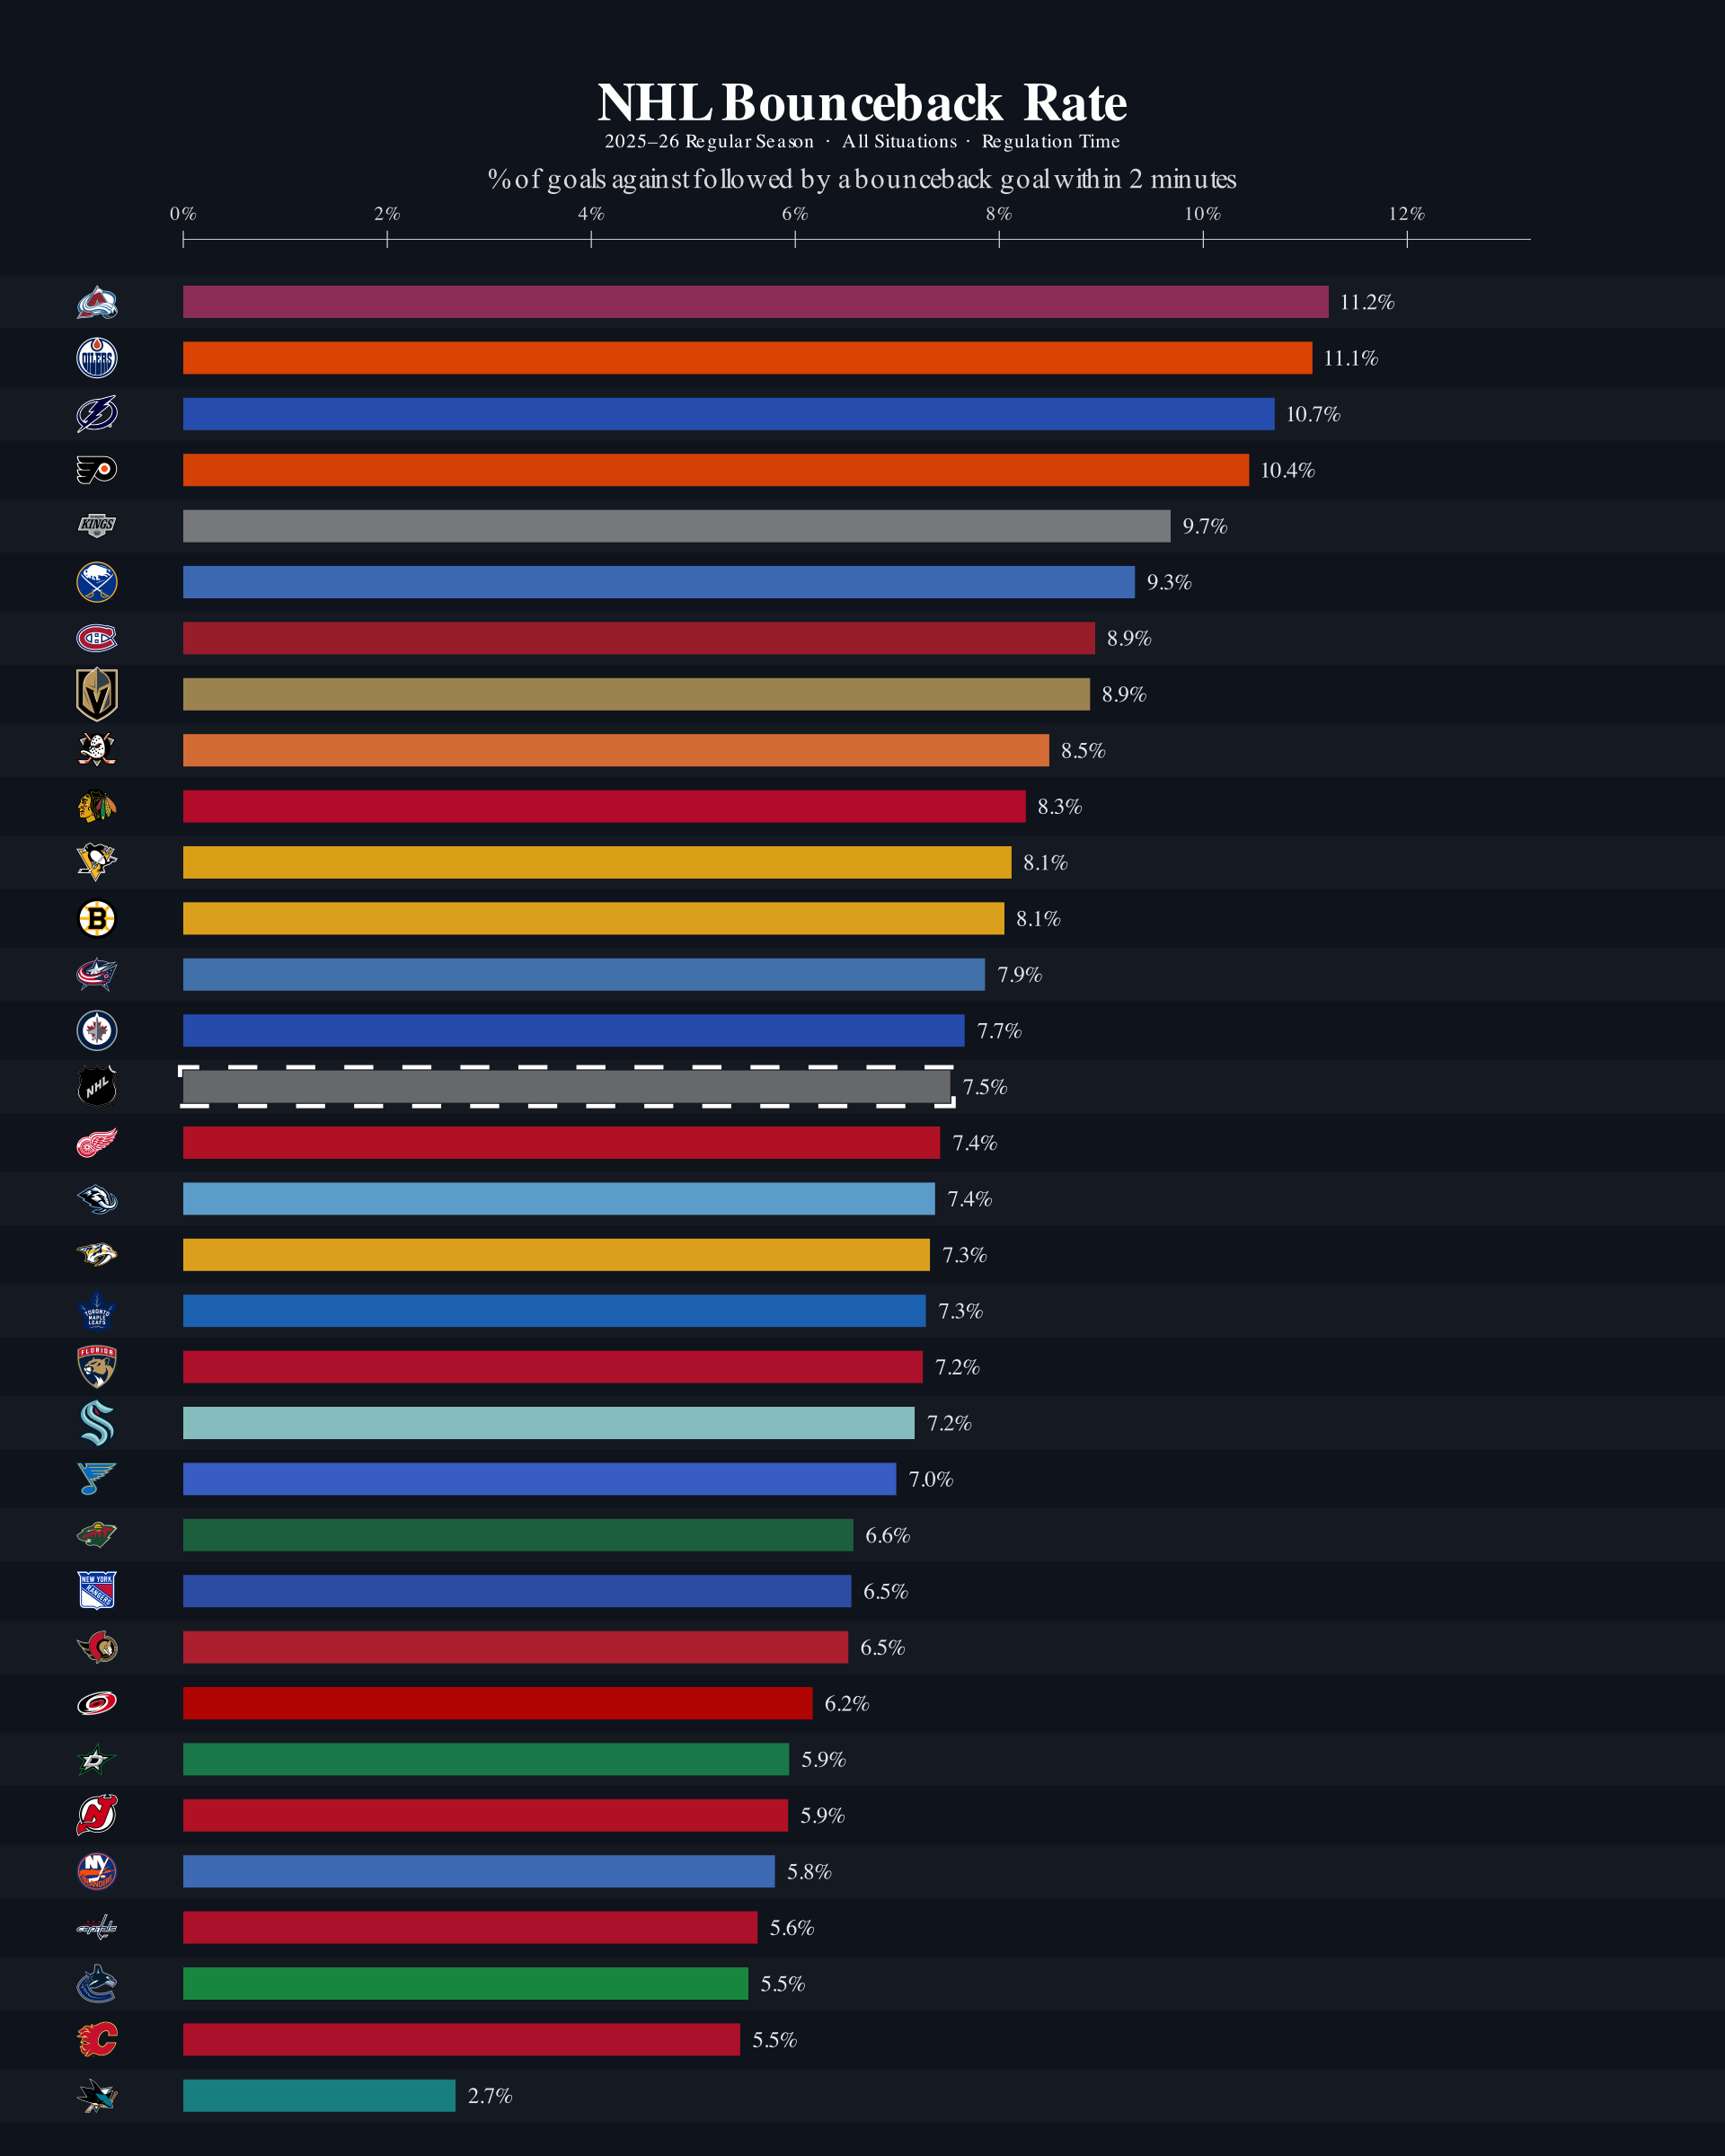
In general there should be some correlation with standings because we can expect more often better performing teams are going to respond to goals against with goals of their own. However, it is interesting to see teams subvert that trend, namely Winnepeg outperforming and Carolina, Minnesota, Utah and San Jose underperforming. This is consistent across the naive metric (below) or the custom metric developed here.
Metric Development and Methodology
This bouncebackability metric is meant to measure how well a team responds to being scored on. Do they often get a goal right back? Or do they crumble and see a decrease in performance? Even worse, do you tend to get scored on back-to-back in a short amount of time? Intuitively, we might look at goals in some short time frame after a goal against and compare those to other teams when they are scored against. How does team performance compare to other teams in the two minutes after a goal against?
We might start with something like this:
There are a few challenges here:
Time: Goals JUST outside of the 2 minutes threshold are excluded. Is there something special about 2 minutes after a goal versus 2:01? Probably not in terms of bouncebackability. OK, let’s extend it, but how far? If we were to extend this time frame to 5 minutes, what about goals scored at different times in this 5 minute period? Should a goal scored 15 seconds after a goal against be valued the same as a goal scored 5 minutes after a goal against in terms of bouncebackability - probably not, the former is a better/quicker bounceback.
Some questions that come to mind:
Should there be a time threshold and if so, what time-frame constitutes a bounceback? 1 min? 2 mins? 5 mins? Within same period?
Instead of a threshold of inclusion/exclusion, should we use a weighting to the bounceback window where goals scored right after a goal (ex. 10 second later) are weighted higher than goals scored 5 mins later?
Goals Against: Currently we’re only accounting for goals for after a goal against but what if the opposing team scores again? A bounceback where you score in reponse to a goal against and as a result are right back in the game is very different than one where the opponent scores two and you score one goal in a flurry of goals.
Some questions that come to mind:
- How do we account for goal flurries in this metric? Should a bounceback goal be counted if the opposing team scores again? What about double bouncebacks where you score twice quickly in response to a previous goal against?
Game State: Currently, we’re counting all game scenarios, including end of game empty net goals and bouncing back after a goal against when the team is already losing 7-1. We should probably only be interest in bouncebacks that are relevant for viable comebacks. Though we are excluding OT (no bounceback possible) and capping the “bounceback-window” at period end (so no cross-period bouncebacks in less than 2 mins of game time are counted), we should probably exclude end of game empty netters or end of period goals where there isn’t a fair shake at a response. If the opponent scores with 5 seconds remaining in the period, you don’t really have a chance for a bounceback in that period so this metric should not be affected. Additionally, should we consider whether the goal against was scored on the powerplay, shorthanded or even strength?
Some questions that come to mind:
Should score state be accounted for in this metric, only counting close games? Should games where there isn’t a realistic chance of coming back count in this metric?
Should cross-period bouncebacks count?
Do we exclude EN goals and end of period goals entirely? A team that scores shortly after an EN goal against are theoretically back in the game state they were in previously before the EN goal so they did bounceback in some sense.
Expected Goals: Currently we are only using actual goals for this metric but there something to be said about a bounceback in momentum that can be measured by expected goals (xGoals or xG). If a team doesn’t generate a goal but generates 5 grade A chances in the 2 minutes after a goal, that is a type of bounceback independent of whether it generated a goal.
Some questions that come to mind:
How should we weight xGoals compared to actual goals?
If included, how would error in xG modelling be included in the error of this metric?
My Solutions:
Time Frame:
We’ll use exponential decay (with 2 minute half-life) on the bounceback time window so quicker reponses are weighted more heavily than slower responses. We’ll use a 5 min cut-off so goals trend towards zero the closer they get to 5 mins since a goal against (bounceback goals at 4m55s since a goal against are less than 20% value in this metric). However, this change complicates the interpretability of the metric. Currently “X% of the time they get a bounceback goal” is easy to interpret but “bouncebackability factor of X” is harder to interpret. More on this later.
Goals Against:
We’ll use a harsh penalty for allowing another goal against in the same time window, regardless of whether the team had a bounceback goal or not. If they did have a bounceback goal, this is better than just allowing another goal against so we should have tiered penalties accordingly. On the other hand, we’ll double count a “double bounceback” where a team responds to a goal against with 2+ goals of their own in quick succession - these are ideal cases to exemplify bouncebackability and should be heavily rewarded.
Game State:
We’ll only include game states that occur in 3 goal-games or less (any goals scored when down 4+ goals are excluded). We won’t compute this metric for OT, games with large goal differentials (either direction), after EN goals, or goals scored in the last 30 seconds of a game (unless there was a bounceback goal in that time that pushed the game to OT). For now we won’t count cross period bouncebacks and keep the period end cap. We’ll count bounceback goals shorthanded and even strength bounceback goals with higher values, and powerplay goals with lower values.
xGoals:
We won’t include the xGoal values (just yet) because it is isn’t a fully optimized model and introduces too much complication and error accounting at this stage.
Normalization and Interpretability
Because we lose the interpretability of the first naive method, we’ll normalize the output values so that the league average is a score of 100 and the scores are relative to that league average.
All teams ranked by Bouncebackability
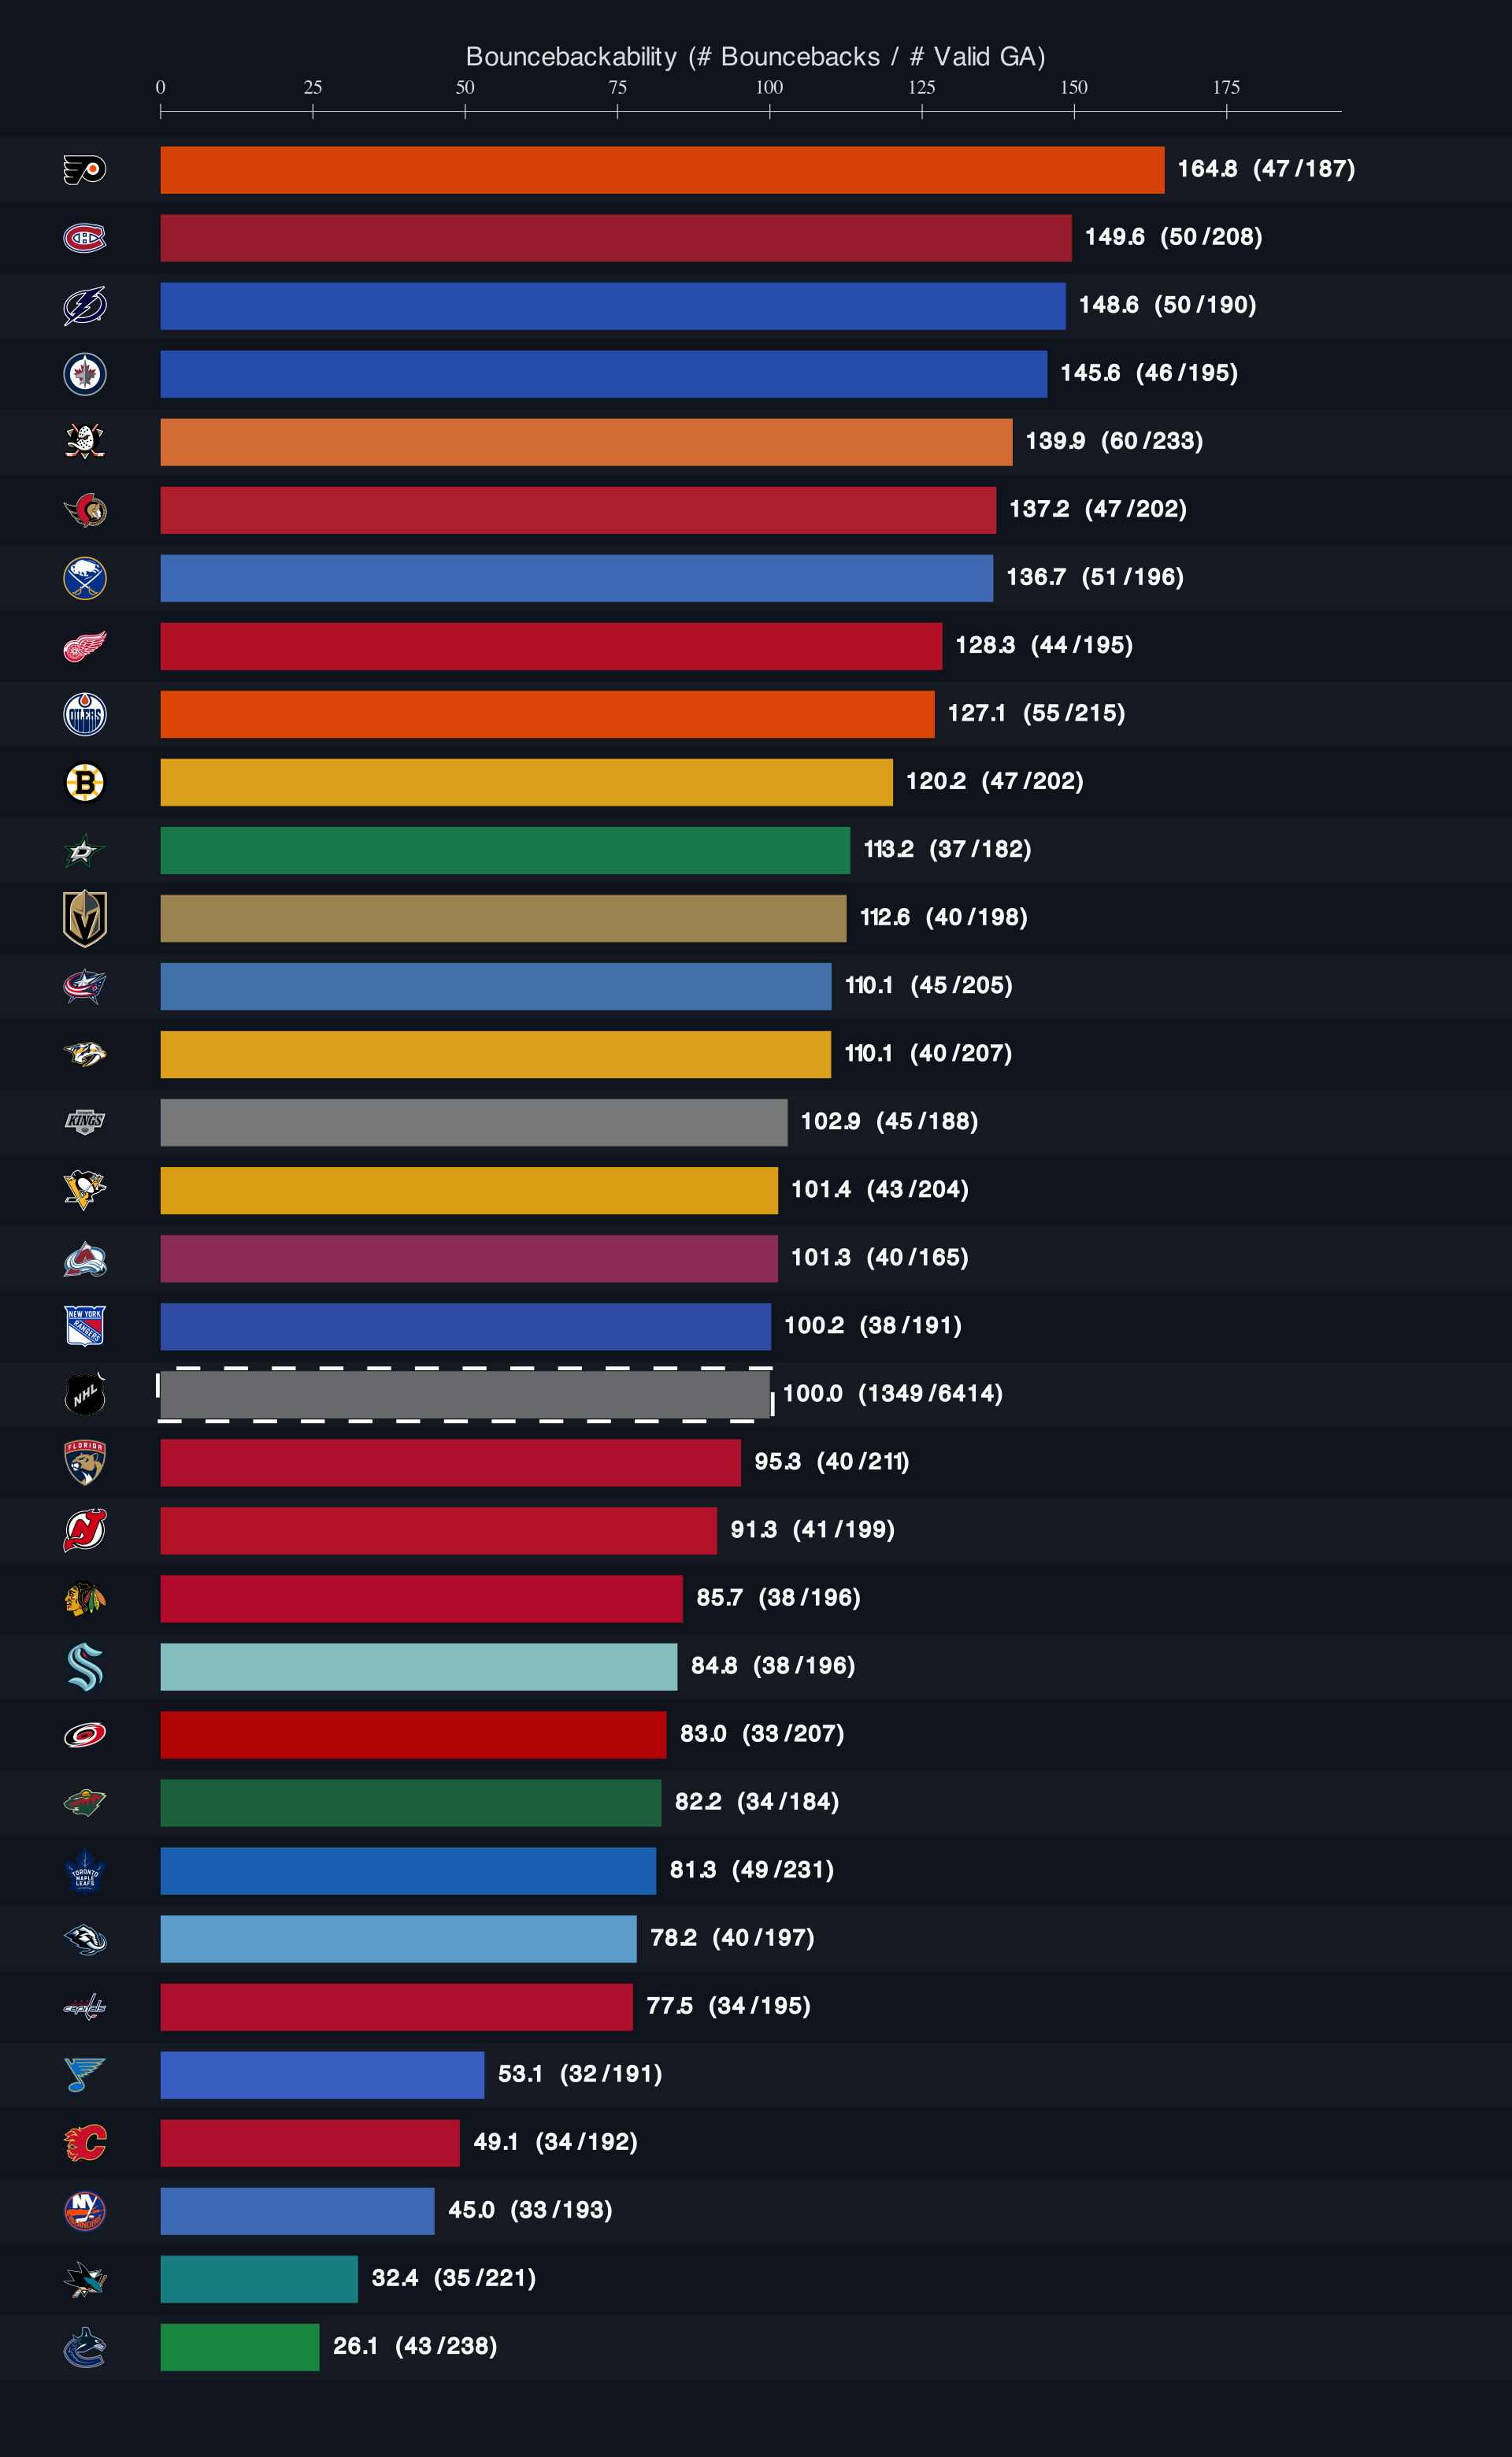
The Whole Kit and Kaboodle
Parameter Summary
| Parameter | Value | Description | What it means |
|---|---|---|---|
| \(t_{\text{buffer}}\) | 10 s | Delay to goal value decay | Goal in first 10 seconds valued at 1 and decay (below) starts after this 10 second buffer |
| \(\lambda\) | \(\ln(2)/120 \approx 0.005776\) s\(^{-1}\) | Decay rate (2-min half-life) | Goal worth 50% after 2 mins, 25% at 4 mins, etc. all counted from after the 10 second buffer |
| \(t_{\max}\) | 300 s (5 min) | Maximum bounceback window | Sliding scale until we cap it at 5 minutes = 18.7% contribution to 0% after 5 mins pass since GA |
| Period cap | 1200 s | Window capped at period end | Don’t consider goals across periods |
| \(t_{\text{late}}\) | 1170 s | Last-30s threshold for exclusion | Only include a bounceback opportunity if there is at least 30 seconds remaining in the period |
| Max deficit | \(d \leq -4\) | Score differential exclusion | Don’t include GA to go down 4+ goals, measuring bouncebacks not comebacks |
| \(m_{\text{SH}}\) | 1.25 | Shorthanded bounceback multiplier | Better bounceback if fewer skaters, use 4v5 multiplier |
| \(m_{\text{EV}}\) | 1.00 | Even-strength bounceback multiplier | Count with no penalty/bonus multiplier |
| \(m_{\text{PP}}\) | 0.80 | Powerplay bounceback multiplier | Easier bounceback if more skaters, use 5v4 multiplier |
| \(P\) | 0.20 | Penalty for no-bounceback flurry | If they score back to back unanswered goals instead |
| Dilution | 0.10 | Bounceback dilution when opp scores again | Score a bounceback goal but then allow another GA, reduce to 10% of contribution |
Filtering
Each goal-against (GA) event for a given team is filtered using 3 filters. Events that fail any filter below are excluded from consideration and they are not treated as missed opportunities.
1. Empty net goals
GA events where defending net is empty are excluded. These occur when the goal is scored on an empty net, no matter the team. Goals where your own net is empty are still included.
2. Large deficit
Game not within 3 goal deficit are excluded. Games are beyond a realistic bounceback threshold but maybe the comeback is starting to go 3 down? If they score again to put it within 2, that goal will be counted.
Let \(d\) be the goal differential from the defending team’s perspective after the goal is scored:
\[d = \text{team\_score\_after} - \text{opponent\_score\_after}\]
If \(d \leq -4\) (the team is trailing by 4 or more after this goal), the event is excluded.
3. Last 30 seconds of a period (no response)
If the goal occurs in the last 30 seconds of a period (\(t_{\text{against}} \geq 1170\)) and no bounceback goal was scored in the remaining window, the event is excluded — the team had no significant opportunity to respond.
If a bounceback goal was scored in those final seconds, the event is included with full weight computation - but only if game went to OT or was decided by that goal. This edge case covers situations like a goal with 25 seconds left answered by an immediately-following goal before the end of the game.
Bounceback Window
For a valid GA event at time \(t_{\text{against}}\) in period \(p\), the response window is:
\[t_{\text{window}} = \min(t_{\text{against}} + 300,\ 1200)\]
The window is capped at period end (1200 seconds) — no cross-period bouncebacks are counted. Goals in other periods that happen to fall within 5 minutes of in-game time are not considered.
Decay Function
A bounceback goal scored at time \(t_{\text{response}} > t_{\text{against}}\) in the same period receives a weight based on how quickly it arrived:
Decay only starts after 10 second buffer have passed.
\[\Delta t = t_{\text{response}} - t_{\text{against}}\]
\[t_{\text{buffer}} = 10\]
\[w(\Delta t) = \begin{cases} 1.00 & \text{if } |\Delta t| <= t_{\text{buffer}} \\ e^{-\lambda \cdot (\Delta t - t_{\text{buffer}})}, \quad \lambda = \frac{\ln 2}{120} \approx 0.005776 \text{ s}^{-1} & \text{if } t_{\text{buffer}} < |\Delta t| \leq t_{\max} \\ 0 & \text{if } |\Delta t| > t_{\max} \end{cases}\]
The half-life is 2 minutes (120 seconds): a goal at exactly 2 minutes 10 seconds is worth half a goal in the first 10 seconds.
Selected weight values:
| \(\Delta t\) | \(w(\Delta t)\) |
|---|---|
| 5 s | 1.000 |
| 10 s | 1.000 |
| 20 s | 0.944 |
| 40 s | 0.833 |
| 60 s (1 min) | 0.749 |
| 130 s (2 min + 10 second buffer) | 0.500 |
| 250 s (4 min 10 sec) | 0.250 |
| 300 s (5 min) | 0.187 |
| 301 s (5 min 1 sec) | 0.00 |
| 360 s (6 min) | 0.00 |
Goals beyond 5 minutes receive zero weight (\(w = 0\) for \(\Delta t > 300\)).
Strength Multiplier
Each bounceback goal’s decay weight is scaled by the skater situation at the time of the response goal:
\[m = \begin{cases} 1.25 & \text{if team has fewer skaters (shorthanded response)} \\ 1.00 & \text{if equal skaters (even strength)} \\ 0.80 & \text{if team has more skaters (powerplay response)} \end{cases}\]
A shorthanded bounceback is more remarkable; a powerplay response is the most advantageous situation and thus credited less.
Contribution Formula
For each valid GA event, let:
- \(\mathcal{B}\) = set of bounceback goals (team scores in window), each with \((\Delta t_i, m_i)\)
- \(\mathcal{O}\) = set of additional opponent goals in the same window
The contribution of this GA event to the team’s raw score is:
\[c = \begin{cases} -P & \text{if } |\mathcal{B}| = 0 \text{ and } |\mathcal{O}| > 0 \\ 0 & \text{if } |\mathcal{B}| = 0 \text{ and } |\mathcal{O}| = 0 \\ \dfrac{1}{10} \displaystyle\sum_{i \in \mathcal{B}} m_i \cdot w(\Delta t_i) & \text{if } |\mathcal{B}| > 0 \text{ and } |\mathcal{O}| > 0 \\ \displaystyle\sum_{i \in \mathcal{B}} m_i \cdot w(\Delta t_i) & \text{if } |\mathcal{B}| > 0 \text{ and } |\mathcal{O}| = 0 \end{cases}\]
where \(P = 0.2\) is the penalty for a goal-against flurry with no response.
Interpretation of each case:
| Case | Description |
|---|---|
| \(|\mathcal{B}|=0\), \(|\mathcal{O}|>0\) | No bounceback, opponent extends lead — penalty \(-P\) |
| \(|\mathcal{B}|=0\), \(|\mathcal{O}|=0\) | No bounceback, quiet window — neutral (0) |
| \(|\mathcal{B}|>0\), \(|\mathcal{O}|>0\) | Bounceback scored but opponent scores again — diluted by \(\times 0.1\) |
| \(|\mathcal{B}|>0\), \(|\mathcal{O}|=0\) | Clean bounceback (including double bounceback if \(|\mathcal{B}| \geq 2\)) — full credit |
Double bouncebacks (\(|\mathcal{B}| \geq 2\)) accumulate weight naturally: \(\sum_i m_i \cdot w(\Delta t_i)\). Two quick response goals contribute more than one, and a second goal arriving 30 seconds after the first contributes at its own decay-discounted value.
Score Normalization
Let \(N_j\) be the number of valid GA events for team \(j\) and \(C_j = \sum c\) be the sum of contributions.
Raw score per team (average contribution per valid GA event):
\[\bar{c}_j = \frac{C_j}{N_j}\]
League average raw score (weighted by valid event count):
\[\bar{c}_{\text{league}} = \frac{\sum_j C_j}{\sum_j N_j}\]
Normalized bounceback score (league average = 100):
\[\text{BB Score}_j = 100 \times \frac{\bar{c}_j}{\bar{c}_{\text{league}}}\]
A score above 100 means the team bounces back better than the league average; below 100 means worse.
About
- Data Source: The data for this visualization was collected from pulling season statistics (current up to Apr 8, 2026) from the NHL’s official API.
- Visualization: Built using manim.